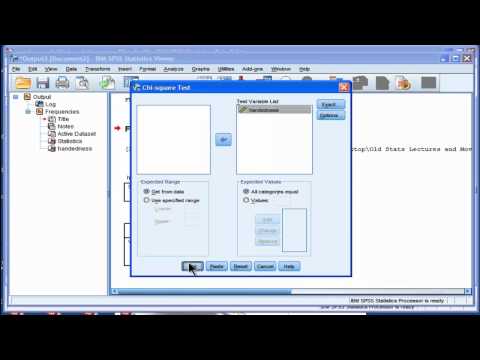
Thumbnail for 2 by 1 Contingency Table Analysis - SPSS (Pearson Chi-Square)

2 by 1 Contingency Table Analysis - SPSS (Pearson Chi-Square)

how2stats

Save 4 minutes

Original Video
Summiz
5 min
Original
1 min
with Summiz
5x
faster learning efficiency

Brief summary

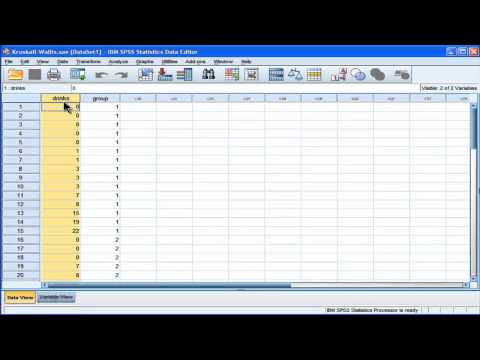
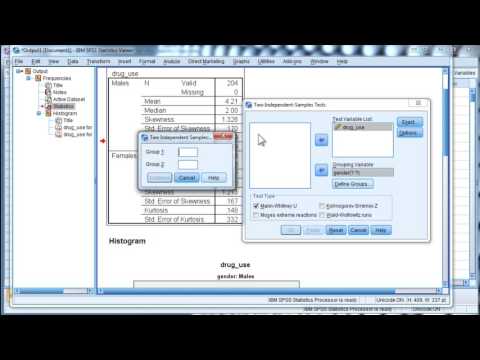
The video shows how to use SPSS to run a Pearson Chi-Square test on a 2x1 contingency table to check if the proportion of right- vs left-handers in a sample significantly differs from chance, revealing a highly significant result.

Categories with 2 by 1 Contingency Table Analysis - SPSS (Pearson Chi-Square)

Table of Contents

Best quote from 2 by 1 Contingency Table Analysis - SPSS (Pearson Chi-Square)

The difference between the observed and the expected is tested with this Chi-square statistic, which is exactly the same as the 2x2 in the contingency table analysis that SPSS provides through this more obvious utility in the cross tabs.

how2stats
2 by 1 Contingency Table Analysis - SPSS (Pearson Chi-Square) cover

Add these4key ideas to your library

You can also export toNotion Notion,Obsidian Obsidian orMarkdown Markdown.
500+ Summaries
Access our growing library of high-quality content summaries
200+ Users
Join our community of dedicated learners and knowledge seekers
Loved Product
Everyone who has tried Summiz is delighted with the results
Quick Takes are free, forever. No billing setup required.
or
Generate free study notes from any YouTube video